To see an equity, ETF or futures chart, click on the Underlying chart button on the toolbar.
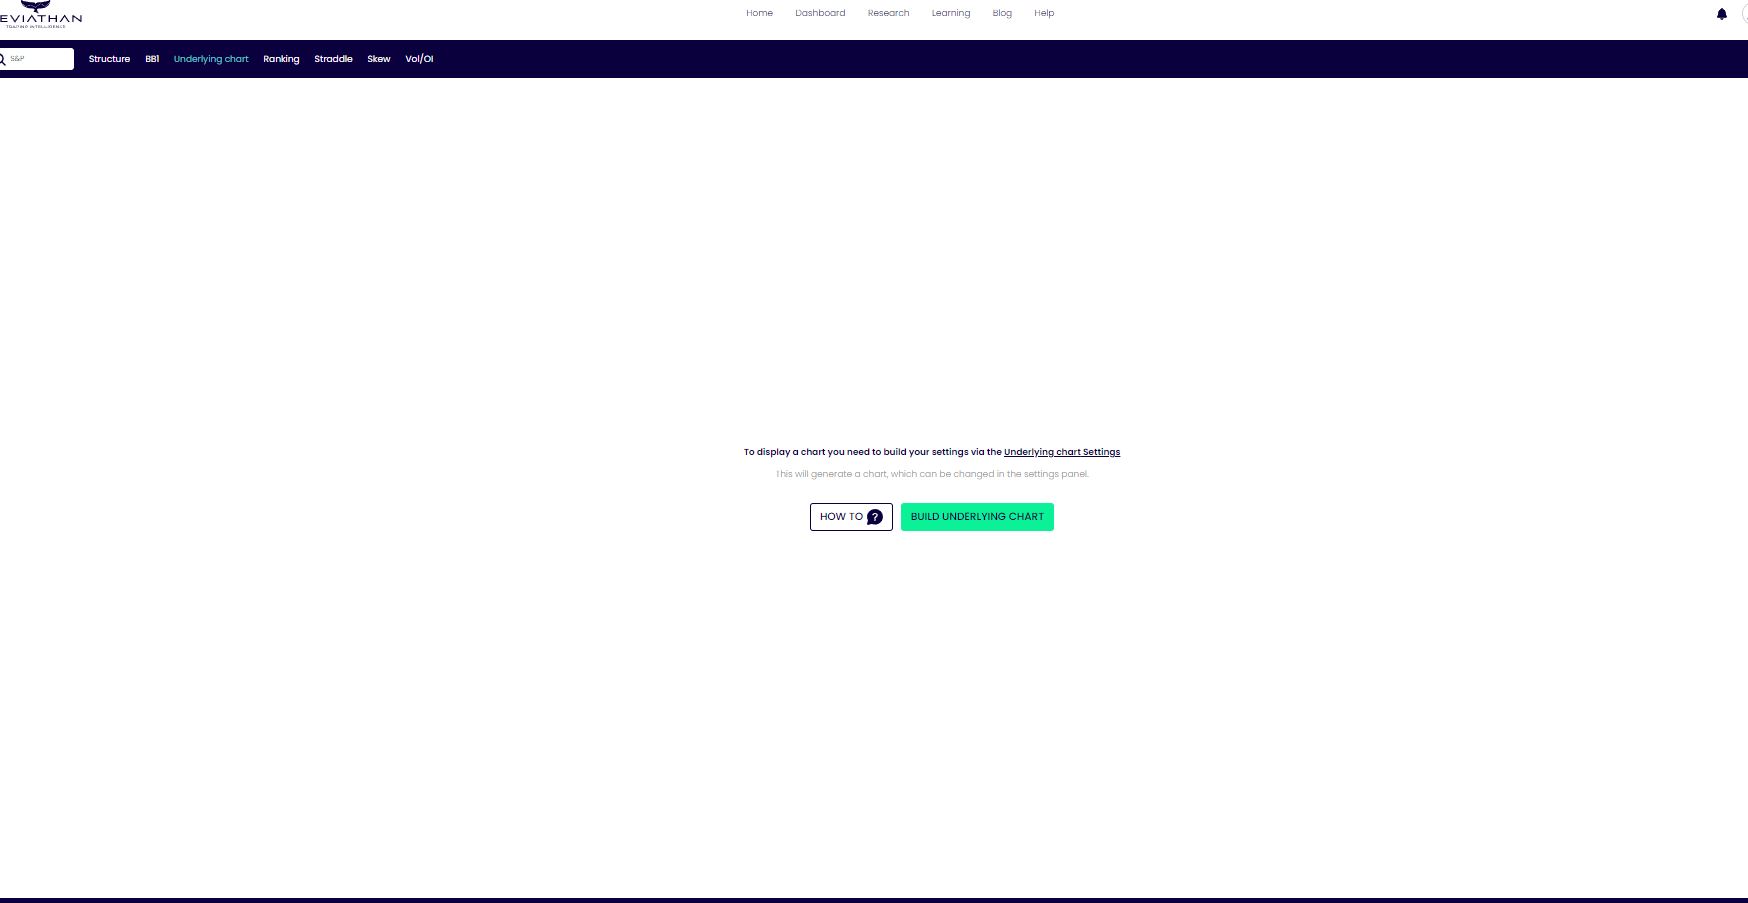
Click on the "BUILD UNDERLYING CHART" button in the middle of the page
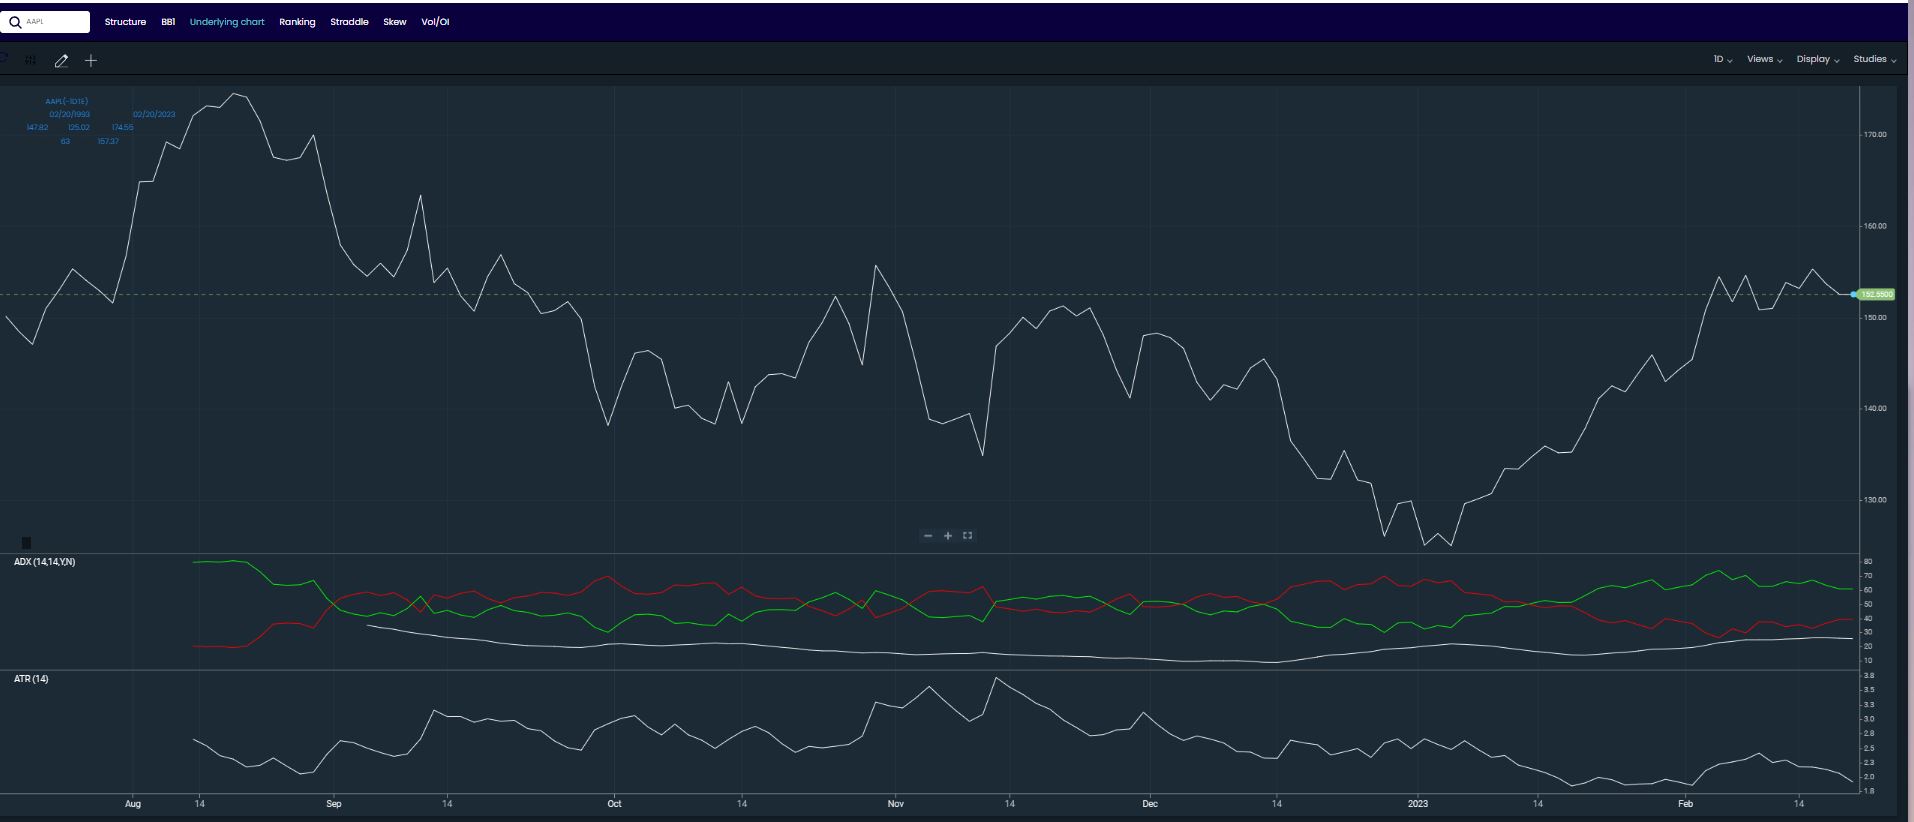
The two chart types are actual historical for an expiry or constant maturity which, specific to futures, displays a chart with the same DTE for every day going back in your desired look back period. Either click on the Future expiry button or override it with the DTE box. Then enter the time frame you desire and click Submit. It is that simple. From there you can use all of the charting functions that are also in the options LINE CHART page.
Related Posts
Line ChartLeviathan uses the World’s Most Powerful HTML5 Charting solution that works seamlessly on any platform…
Big Boy (BB1)BB1 is a groundbreaking AI-driven analysis tool that instantly evaluates over a billion potential option…
-
SYNTHETICSSynthetics: When I first started trading options I used to have a little card written…
-
GammaGAMMA I. Definition: An option’s gamma represents the change in its delta in response to…
USES FOR CALLS1. Long calls are bullish speculation with fixed, limited risk. In futures options, cach options…
DeltaDELTA Definition: The rate of change in the theoretical value of an option over a…
COVERED WRITESo Most common options strategy in use o Can be used to increase the rate…
RankingRANKING: Ranking gives you the ability to analyze current volatilities across multiple expirations and even…
Leave a Reply