Z-score The deviation of the value for an individual from the median value of the reference population, divided by the standard Deviation for the reference population
Z- Score =(Observed value) – (Median reference value)
**Standard deviation of reference population**A fixed Z score interval implies a fixed height or weight difference for children of a given age Advantage:- Allows mean and SD calculation for a group of Z score in population based applications Percentile It refers to a point on the scale, when series of data is arranged in an ascending order for a measurement. It is an ordinal scale and shows merely the order of rating on the scale.The rank position of an individual on a given reference distribution, stated in terms of what percentage of the group the individual equals or exceeds .
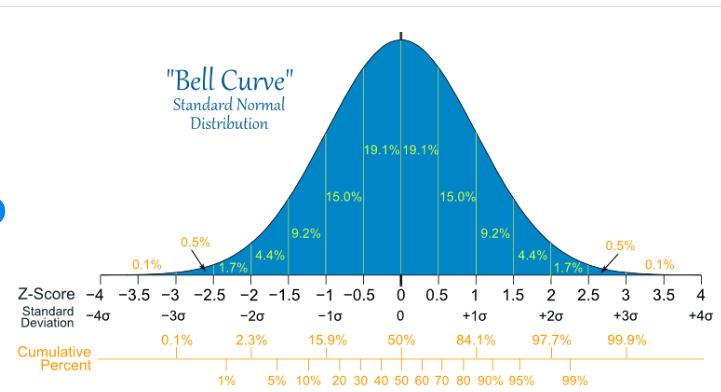
The Z-score is a quantile, and takes values from −∞ to ∞
. The cumulative percentile is bounded from 0 to 1. When the distribution is known, the percentile can map 1-1 to any observation for any distribution, whereas the Z-score only has this property for normally distributed data; hence these summaries are equivalent when normality is met.
Leave a Reply