Mindblown: a blog about philosophy.
-
Add Structure / Structure Panel
The Structure Panel is the place where options structures are designed. Be it a simple Call/Put, a Vertical Spread Strip, a Condor Spread, or any number option combinations. This is the initial step in the deep dive analysis of your option structure. When a structure is built, it can then be analyzed historically via a…
-
Heat Map
The Heat Map Heat Map is a forward looking tool to show how a structure performs with respect to time elapsing and future movement. Some structures monetize quickly with respect to futures movement and some don’t monetize much at all until very near expiration. It is important to know the intricacies of the path rather…
-
Skew
The Skew Page can be described as looking at many option expiries skews one way or looking at one option expiry skew many ways. The page defaults to comparing the skews of many expiries and defaults to the previous day’s settlements. The Y axis is the annualized volatility and the X axis is the delta.…
-
Volume & Open Interest
The Volume and Open Interest page (Vol/OI) is a very useful tool in analyzing where Open Interest is targeting, whether it is adding or decreasing, and most importantly it shows how Customers (and vice versa the market making community) are positioned. Upon clicking the Vol/OI button, you are sent to the default Open Interest by…
-
Technical Analysis
To see an equity, ETF or futures chart, click on the Underlying chart button on the toolbar. Click on the "BUILD UNDERLYING CHART" button in the middle of the page The two chart types are actual historical for an expiry or constant maturity which, specific to futures, displays a chart with the same DTE for…
-
Line Chart
Leviathan uses the World’s Most Powerful HTML5 Charting solution that works seamlessly on any platform – web, desktop, tablet, mobile, utilizing 100+ technical analysis indicators, trading tools, and unique features. To view a chart you may either create one via STRUCTURE, where a "Line Chart" BUTTON will appear in the toolbar above the Greeks or…
-
Ranking
RANKING: Ranking gives you the ability to analyze current volatilities across multiple expirations and even products and compare them to where they have been across different timeframes in either percentile or Z-score (for a description of percentile and Z-Score, go to https://www.leviathanfm.com/learning/general/percentiles-z-scores), then rank them from cheapest to most expensive. You can easily select the…
-
Gamma
GAMMA I. Definition: An option’s gamma represents the change in its delta in response to an underlying price increase/decrease. The delta is not static and changes as it goes from out-of-the money to in-the-money. The gamma is also known as the delta of the delta Ex: The 100 call has a +.50 delta. The gamma…
-
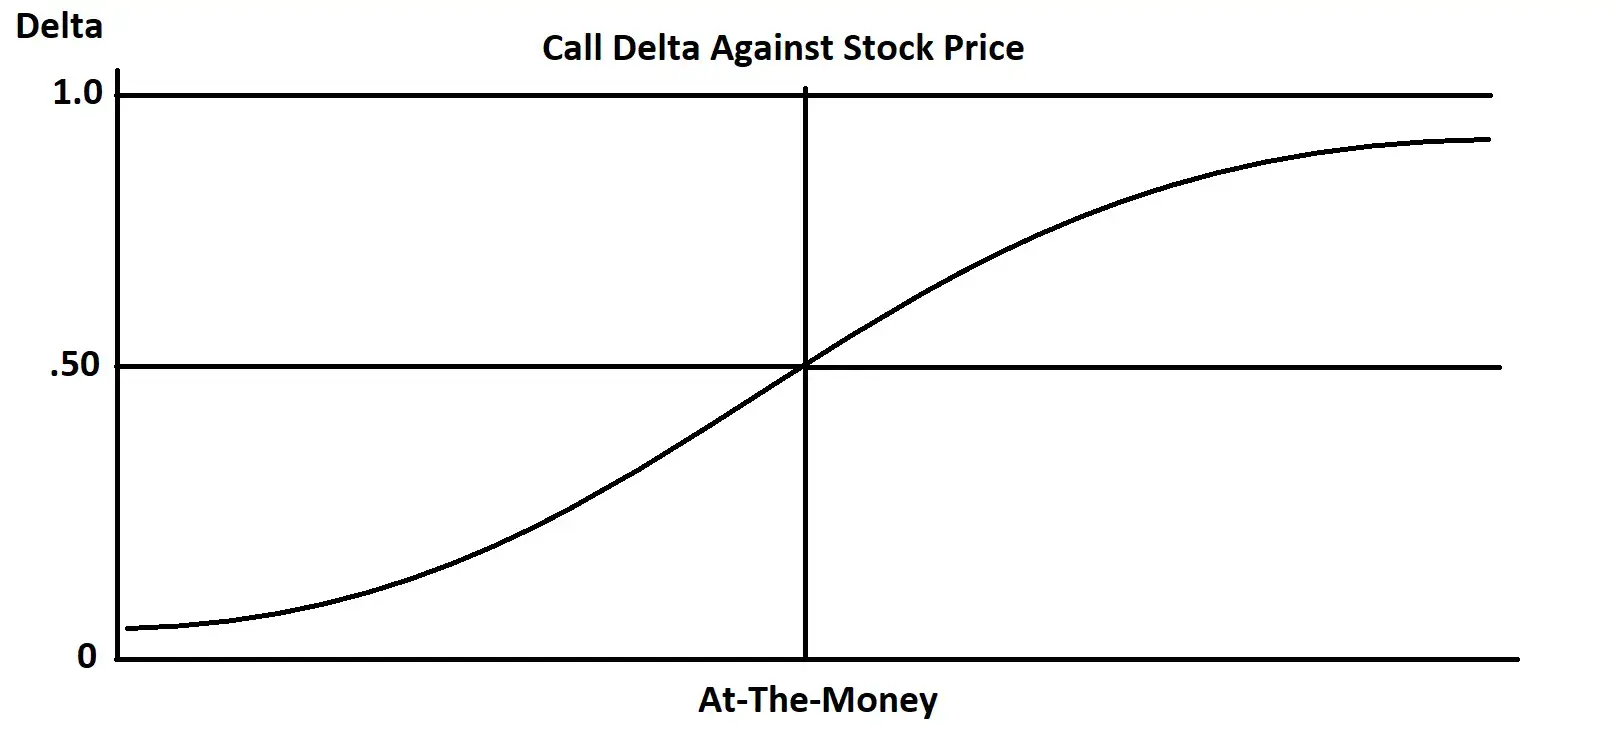
Delta
DELTA Definition: The rate of change in the theoretical value of an option over a one-point change in underlying price. Expressed as a percentage, it can also be interpreted as the equivalent amount of underlying that an option represents, or hedge ratio. Calls have positive deltas, puts have negative deltas. –The Delta has various interpretations:…
-
FED’S BULLARD: AT THIS POINT, I SEE POLICY RATE IN THE RANGE OF 5.25% TO 5.5% AS APPROPRIATE
Got any book recommendations?